Tutorial: Integrating GWAS with Single-Cell Data using cellink#
This tutorial demonstrates how to integrate GWAS (Genome-Wide Association Studies) data with single-cell genomics using scDRS and Seismic through the cellink package. scDRS identifies disease-relevant invididual cells, tests for heterogeneity within cell types and cell-level disease associations and correlates disease scores with cell-level variables. Seismic links cell types with traits and identifies influential genes driving associations. Both scDRS and seismic benefit from larger sample sizes. Aim for >50 donors and well-powered GWAS for robust results. The results depend on cell type granularity. Consider running analyses at multiple resolutions.
We also demonstrate how to identify relevant gene sets using MAGMA. Both tools work seamlessly with cellink's DonorData structure. To use scDRS please install cellink via pip install 'cellink[scdrs]'. To use Seismic please install it via: R -e "devtools::install_github('ylaboratory/seismicGWAS')" and additionally install rpy2 via: pip install rpy2.
Setup#
import numpy as np
import pandas as pd
import matplotlib.pyplot as plt
import seaborn as sns
import numba

numba.set_num_threads(1)
import os

os.environ["OMP_NUM_THREADS"] = "1"
os.environ["OPENBLAS_NUM_THREADS"] = "1"
os.environ["MKL_NUM_THREADS"] = "1"
os.environ["VECLIB_MAXIMUM_THREADS"] = "1"
os.environ["NUMEXPR_NUM_THREADS"] = "1"
import scanpy as sc

from cellink.resources import get_dummy_onek1k, get_gwas_catalog_study_summary_stats
from cellink.tl.external import run_scdrs, run_seismic, run_magma_pipeline

dd = get_dummy_onek1k(config_path="../../src/cellink/resources/config/dummy_onek1k.yaml", verify_checksum=False)
dd.G.obs["donor_id"] = dd.G.obs.index

print(f"Dataset shape: {dd.shape}")
print(f"Cell types: {dd.C.obs['predicted.celltype.l2'].unique()[:5]}")
[2026-01-14 19:11:20,541] INFO:root: /Users/larnoldt/cellink_data/dummy_onek1k/dummy_onek1k.dd.h5 already exists
[2026-01-14 19:11:20,541] WARNING:root: No checksum provided, skipping verification
[2026-01-14 19:11:21,651] INFO:root: Loaded dummy OneK1K dataset: (100, 146939, 125366, 34073)
Dataset shape: (100, 146939, 125366, 34073)
Cell types: ['gdT', 'NK', 'CD8 TEM', 'CD4 Naive', 'CD4 TCM']
Categories (31, object): ['ASDC', 'B intermediate', 'B memory', 'B naive', ..., 'cDC2', 'dnT', 'gdT', 'pDC']
We filter the DonorData object to speed-up the computation for demonstration purposes.
celltype_counts = dd.C.obs["predicted.celltype.l2"].value_counts()
celltypes_of_interest = celltype_counts[celltype_counts > 100].index
dd.C = dd.C[dd.C.obs["predicted.celltype.l2"].isin(celltypes_of_interest)].copy()
dd.C = dd.C[:, dd.C.var["vst.variable"] == 1].copy()
We utilize a publicly available GWAS summary statistic, here for iunstance for Type 2 Diabetes.
gwas_df = get_gwas_catalog_study_summary_stats("GCST90018926", genome_build="GRCh37")
gwas_df
[2026-01-14 19:11:23,064] INFO:root: Fetching https://www.ebi.ac.uk/gwas/rest/api/v2/studies/GCST90018926
[2026-01-14 19:11:23,258] INFO:root: User requested GRCh37, skipping harmonised files and searching base directory
[2026-01-14 19:11:23,343] INFO:root: Selected file matching requested build GRCh37: GCST90018926_buildGRCh37.tsv.gz
[2026-01-14 19:11:23,344] INFO:root: Using build-specific summary statistics (build: GRCh37)
[2026-01-14 19:11:23,346] INFO:root: Downloading http://ftp.ebi.ac.uk/pub/databases/gwas/summary_statistics/GCST90018001-GCST90019000/GCST90018926/GCST90018926_buildGRCh37.tsv.gz to /Users/larnoldt/cellink_data/GCST90018926_summary_stats.tsv.gz
| chromosome | base_pair_location | effect_allele | other_allele | effect_allele_frequency | beta | standard_error | p_value | variant_id | |
|---|---|---|---|---|---|---|---|---|---|
| 0 | 1 | 100000012 | T | G | 0.280989 | -0.0146 | 0.0068 | 0.03234 | NaN |
| 1 | 1 | 10000006 | A | G | 0.005652 | 0.0336 | 0.0561 | 0.54980 | NaN |
| 2 | 1 | 100000135 | T | A | 0.001687 | -0.0276 | 0.1122 | 0.80540 | NaN |
| 3 | 1 | 100000374 | C | G | 0.000579 | 0.2396 | 0.1991 | 0.22880 | NaN |
| 4 | 1 | 100000827 | T | C | 0.332151 | -0.0148 | 0.0065 | 0.02345 | NaN |
| ... | ... | ... | ... | ... | ... | ... | ... | ... | ... |
| 25845086 | X | 99998829 | T | C | 0.439544 | -0.0103 | 0.0050 | 0.03884 | NaN |
| 25845087 | X | 99999212 | CT | C | 0.542889 | 0.0157 | 0.0087 | 0.07114 | NaN |
| 25845088 | X | 99999349 | A | G | 0.551784 | 0.0102 | 0.0050 | 0.03944 | NaN |
| 25845089 | X | 9999977 | A | G | 0.001073 | -0.3525 | 0.1717 | 0.04007 | NaN |
| 25845090 | X | 99999963 | C | T | 0.000815 | 0.0439 | 0.2045 | 0.83000 | NaN |
25845091 rows × 9 columns
We convert the public GWAS statistic to gene-level statistics using MAGMA. MAGMA needs to be downloaded as shown below:
import requests
import zipfile
import io
import os
import stat

url = "https://vu.data.surf.nl/public.php/dav/files/1M1d9vHtVidEwvU/?accept=zip"

r = requests.get(url)
r.raise_for_status()

with zipfile.ZipFile(io.BytesIO(r.content)) as z:
    z.extractall("magma")

for root, dirs, files in os.walk("magma"):
    for file in files:
        path = os.path.join(root, file)
        st = os.stat(path)
        os.chmod(path, st.st_mode | stat.S_IEXEC)
custom_mapping = {
    "chromosome": "CHR",
    "base_pair_location": "BP",
    "p_value": "P",
}

magma_file = run_magma_pipeline(
    gwas_df,
    output_prefix="trait",
    col_mapping=custom_mapping,
    n_samples=667504,
    magma_bin="./magma/magma",
    genome_build="GRCh37",
    gene_id_type="ensembl",
    config_file="../../configs/magma.yaml",
    ld_source="dd_genotypes",
    dd=dd,
)
[2026-01-14 19:11:59,920] INFO:cellink.tl.external._magma: Starting MAGMA pipeline
[2026-01-14 19:11:59,921] INFO:cellink.tl.external._magma: Preparing MAGMA input files from DonorData
[2026-01-14 19:11:59,921] INFO:cellink.tl.external._magma: Downloading/checking gene location file
[2026-01-14 19:11:59,925] INFO:cellink.tl.external._magma: Using cached gene location file: /Users/larnoldt/cellink_data/magma_references/NCBI37.3.gene.loc
[2026-01-14 19:11:59,925] INFO:cellink.tl.external._magma: Using cached converted gene location file: /Users/larnoldt/cellink_data/magma_references/GRCh37_ensembl.gene.loc
[2026-01-14 19:11:59,926] INFO:cellink.tl.external._magma: Preparing SNP location and p-value files
[2026-01-14 19:12:32,520] INFO:cellink.tl.external._magma: Created SNP location file: trait.snp_loc.txt
[2026-01-14 19:12:49,809] INFO:cellink.tl.external._magma: Created p-value file: trait.p_val.txt
[2026-01-14 19:12:49,810] INFO:cellink.tl.external._magma: Exporting genotypes to PLINK format for LD reference
[2026-01-14 19:12:49,826] INFO:cellink.tl.external._magma: Filtering to 137268 common variants (MAF > 0.01) from 146939 total variants
Writing FAM... done.
Writing BIM...
done.
[2026-01-14 19:12:50,437] INFO:cellink.tl.external._magma: Created PLINK files: trait_ld_ref.{bed,bim,fam}
[2026-01-14 19:12:50,789] INFO:cellink.tl.external._magma: Running MAGMA SNP annotation
[2026-01-14 19:12:50,789] INFO:cellink.tl.external._magma: Running: ./magma/magma --annotate window=35,10 --snp-loc trait.snp_loc.txt --gene-loc /Users/larnoldt/cellink_data/magma_references/GRCh37_ensembl.gene.loc --out trait
[2026-01-14 19:13:21,381] INFO:cellink.tl.external._magma: Welcome to MAGMA v1.10 (custom)
Using flags:
	--annotate window=35,10
	--snp-loc trait.snp_loc.txt
	--gene-loc /Users/larnoldt/cellink_data/magma_references/GRCh37_ensembl.gene.loc
	--out trait

Start time is 19:12:52, Wednesday 14 Jan 2026

Starting annotation...
Reading gene locations from file /Users/larnoldt/cellink_data/magma_references/GRCh37_ensembl.gene.loc...
	adding window: 35000bp (before), 10000bp (after)
	20134 gene locations read from file
	chromosome  1: 1964 genes
	chromosome  2: 1154 genes
	chromosome  3: 1037 genes
	chromosome  4: 710 genes
	chromosome  5: 859 genes
	chromosome  6: 1812 genes
	chromosome  7: 890 genes
	chromosome  8: 635 genes
	chromosome  9: 742 genes
	chromosome 10: 729 genes
	chromosome 11: 1271 genes
	chromosome 12: 1030 genes
	chromosome 13: 305 genes
	chromosome 14: 590 genes
	chromosome 15: 539 genes
	chromosome 16: 760 genes
	chromosome 17: 1180 genes
	chromosome 18: 268 genes
	chromosome 19: 1571 genes
	chromosome 20: 518 genes
	chromosome 21: 229 genes
	chromosome 22: 417 genes
	chromosome  X: 904 genes
	chromosome  Y: 20 genes
Reading SNP locations from file trait.snp_loc.txt...
	SNPs mapped so far: 573181
	SNPs mapped so far: 1188856
	SNPs mapped so far: 1678112
	SNPs mapped so far: 2195754
	SNPs mapped so far: 2728164
	SNPs mapped so far: 3268753
	SNPs mapped so far: 3657873
	SNPs mapped so far: 4143741
	SNPs mapped so far: 4634411
	SNPs mapped so far: 5143524
	SNPs mapped so far: 5658084
	SNPs mapped so far: 6242751
	SNPs mapped so far: 6758132
	SNPs mapped so far: 7258085
	SNPs mapped so far: 7844182
	SNPs mapped so far: 8388563
	SNPs mapped so far: 8929339
	SNPs mapped so far: 9565621
	SNPs mapped so far: 10102283
	SNPs mapped so far: 10505115
	SNPs mapped so far: 11155688
	SNPs mapped so far: 11736044
	SNPs mapped so far: 12343996
	SNPs mapped so far: 13008607
	SNPs mapped so far: 13607307

	25845091 SNP locations read from file
	of those, 13877369 (53.69%) mapped to at least one gene
Writing annotation to file trait.genes.annot
	for chromosome  4, 4 genes are empty (out of 710)
	for chromosome  9, 1 gene is empty (out of 742)
	for chromosome  Y, 20 genes are empty (out of 20)
	at least one SNP mapped to each of a total of 20109 genes (out of 20134)


End time is 19:13:21, Wednesday 14 Jan 2026 (elapsed: 00:00:29)

[2026-01-14 19:13:21,382] INFO:cellink.tl.external._magma: Annotation complete: trait.genes.annot
[2026-01-14 19:13:21,382] INFO:cellink.tl.external._magma: Running MAGMA gene analysis
[2026-01-14 19:13:21,383] INFO:cellink.tl.external._magma: Running: ./magma/magma --bfile trait_ld_ref --pval trait.p_val.txt N= 667504 --gene-annot trait.genes.annot --out trait
[2026-01-14 19:13:32,576] INFO:cellink.tl.external._magma: Welcome to MAGMA v1.10 (custom)
Using flags:
	--bfile trait_ld_ref
	--pval trait.p_val.txt N= 667504
	--gene-annot trait.genes.annot
	--out trait

Start time is 19:13:21, Wednesday 14 Jan 2026

Loading PLINK-format data...
Reading file trait_ld_ref.fam... 100 individuals read
Reading file trait_ld_ref.bim... 137268 SNPs read
Preparing file trait_ld_ref.bed...

Reading SNP p-values from file trait.p_val.txt...
	detected 2 variables in file
	using variable: variable 1 (SNP id)
	using variable: variable 2 (p-value)
	read 25845091 lines from file, containing valid SNP p-values for 127 SNPs in data (0.0004914% of lines, 0.09252% of SNPs in data)
Loading gene annotation from file trait.genes.annot...
	20109 gene definitions read from file
	found 83 genes containing valid SNPs in genotype data


Starting gene analysis...
	using model: SNPwise-mean

	writing gene analysis results to file trait.genes.out
	writing intermediate output to file trait.genes.raw


End time is 19:13:32, Wednesday 14 Jan 2026 (elapsed: 00:00:11)

[2026-01-14 19:13:32,576] INFO:cellink.tl.external._magma: Gene analysis complete: trait.genes.out
[2026-01-14 19:13:32,577] INFO:cellink.tl.external._magma: MAGMA pipeline complete! Results: trait.genes.out
# Or with a 1000G panel (no DonorData needed at all)
"""
magma_file = run_magma_pipeline(
    gwas_df,
    output_prefix="trait",
    col_mapping=custom_mapping,
    n_samples=667504,
    ld_source="reference_panel",
    reference_panel="EUR",
    genome_build="GRCh37",
    gene_id_type="ensembl",
    config_file="../../configs/magma.yaml",
    magma_bin="./magma/magma",
)
"""

# Or with your own pre-built PLINK panel
"""
magma_file = run_magma_pipeline(
    gwas_df,
    output_prefix="trait",
    col_mapping=custom_mapping,
    n_samples=667504,
    ld_source="external",
    external_ld_prefix="/data/ukbb_eur_ref",  # .bed/.bim/.fam live here
    genome_build="GRCh37",
    gene_id_type="ensembl",
    config_file="../../configs/magma.yaml",
    magma_bin="./magma/magma",
)
"""
Part 1: scDRS Analysis - Cell-Level Disease Associations#
scDRS identifies individual cells with excess expression of disease-associated genes and performs downstream analyses at the cell group level.
magma_results = pd.read_csv("trait.genes.out", sep=r"\s+")

top_genes = magma_results.nsmallest(1000, "P")["GENE"].tolist()
gene_weights = magma_results.nsmallest(1000, "P")["ZSTAT"].tolist()

gene_sets = {"Type2Diabetes": (top_genes, gene_weights)}
Running scDRS#
results_scdrs, downstream_results = run_scdrs(
    dd.C,
    gene_sets=gene_sets,
    group_analysis=["predicted.celltype.l2"],  # Cell type column
    corr_analysis=["n_genes"],  # Cell-level variables
    gene_analysis=True,
    n_ctrl=1000,
    prefix="t2d_scdrs",
    save_results=True,
)

score_df = results_scdrs["Type2Diabetes"]
print(f"Computed scores for {len(score_df)} cells")
print(score_df.head())

ct_results = downstream_results["Type2Diabetes"]["group_predicted.celltype.l2"]
print("\nTop cell type associations:")
print(ct_results.sort_values("assoc_mcp").head())
[2026-01-14 19:13:32,590] INFO:cellink.tl.external._scdrs: Filtering cells and genes
[2026-01-14 19:13:32,947] INFO:cellink.tl.external._scdrs: Log-normalizing data
[2026-01-14 19:13:32,967] INFO:cellink.tl.external._scdrs: Preprocessing data for scDRS
Too few genes for 20*20 bins, setting n_mean_bin=n_var_bin=15
[2026-01-14 19:13:34,440] INFO:cellink.tl.external._scdrs: Computing scDRS scores for 1 trait(s)
[2026-01-14 19:13:34,447] INFO:cellink.tl.external._scdrs: Processing Type2Diabetes
[2026-01-14 19:14:21,638] INFO:cellink.tl.external._scdrs: Computing KNN graph for heterogeneity analysis
[2026-01-14 19:14:54,044] INFO:cellink.tl.external._scdrs: Performing group analysis for Type2Diabetes
[2026-01-14 19:15:41,759] INFO:cellink.tl.external._scdrs: Performing correlation analysis for Type2Diabetes
[2026-01-14 19:15:41,868] INFO:cellink.tl.external._scdrs: Performing gene analysis for Type2Diabetes
Computed scores for 12796 cells
                     raw_score  norm_score   mc_pval      pval  nlog10_pval  \
barcode
CGTGTCTGTGTAAGTA-15  -0.624232   -1.889532  0.983017  0.980244     0.008666
AGCTCTCAGGCTCATT-15   0.130947   -0.153074  0.451548  0.510812     0.291739
CCTTACGGTTGGAGGT-15   0.667973    0.250309  0.308691  0.329169     0.482582
TCAGATGCACACGCTG-15  -0.143528   -0.887485  0.856144  0.858069     0.066478
CTTGGCTCAGTTTACG-15   0.788558    1.176018  0.119880  0.116356     0.934213

                       zscore  ctrl_norm_score_0  ctrl_norm_score_1  \
barcode
CGTGTCTGTGTAAGTA-15 -2.058819           0.267834           0.926833
AGCTCTCAGGCTCATT-15 -0.027105          -0.365848           0.545545
CCTTACGGTTGGAGGT-15  0.442210          -0.420056           0.128674
TCAGATGCACACGCTG-15 -1.071683           0.176786          -1.473952
CTTGGCTCAGTTTACG-15  1.193404           2.300739          -0.026468

                     ctrl_norm_score_2  ctrl_norm_score_3  ...  \
barcode                                                    ...
CGTGTCTGTGTAAGTA-15          -1.950018           0.846829  ...
AGCTCTCAGGCTCATT-15          -0.660499          -0.421251  ...
CCTTACGGTTGGAGGT-15          -1.657565          -0.790750  ...
TCAGATGCACACGCTG-15           0.430132           0.169690  ...
CTTGGCTCAGTTTACG-15           0.081012          -0.892813  ...

                     ctrl_norm_score_990  ctrl_norm_score_991  \
barcode
CGTGTCTGTGTAAGTA-15             0.797848             1.778614
AGCTCTCAGGCTCATT-15             2.574770             0.686327
CCTTACGGTTGGAGGT-15            -0.675235            -0.703569
TCAGATGCACACGCTG-15            -0.211518             0.571995
CTTGGCTCAGTTTACG-15            -0.092311            -0.417120

                     ctrl_norm_score_992  ctrl_norm_score_993  \
barcode
CGTGTCTGTGTAAGTA-15            -1.753560            -0.200784
AGCTCTCAGGCTCATT-15             0.055508             0.798800
CCTTACGGTTGGAGGT-15             0.849822             0.130330
TCAGATGCACACGCTG-15             1.412158            -0.806102
CTTGGCTCAGTTTACG-15             0.595823             1.434147

                     ctrl_norm_score_994  ctrl_norm_score_995  \
barcode
CGTGTCTGTGTAAGTA-15             0.529092            -0.870124
AGCTCTCAGGCTCATT-15            -0.381140            -0.714676
CCTTACGGTTGGAGGT-15            -0.451932            -1.172898
TCAGATGCACACGCTG-15             0.431330            -0.639225
CTTGGCTCAGTTTACG-15            -0.064080            -0.349314

                     ctrl_norm_score_996  ctrl_norm_score_997  \
barcode
CGTGTCTGTGTAAGTA-15            -0.232315             1.080969
AGCTCTCAGGCTCATT-15            -1.077246             1.864670
CCTTACGGTTGGAGGT-15            -0.497949            -0.627890
TCAGATGCACACGCTG-15            -0.784326             1.579551
CTTGGCTCAGTTTACG-15            -1.104226            -0.314114

                     ctrl_norm_score_998  ctrl_norm_score_999
barcode
CGTGTCTGTGTAAGTA-15            -0.032912            -0.570250
AGCTCTCAGGCTCATT-15            -0.311510            -1.266399
CCTTACGGTTGGAGGT-15             2.078641            -0.770171
TCAGATGCACACGCTG-15            -0.359648            -0.474806
CTTGGCTCAGTTTACG-15             0.008661            -0.367048

[5 rows x 1006 columns]

Top cell type associations:
                  n_cell  n_ctrl  assoc_mcp  assoc_mcz  hetero_mcp  \
group
NK Proliferating   131.0  1000.0   0.002997   2.961049    0.185814
pDC                142.0  1000.0   0.020979   2.464431    0.113886
Plasmablast        385.0  1000.0   0.053946   1.888287    0.094905
dnT                 56.0  1000.0   0.094905   1.293969    0.471528
NK                2337.0  1000.0   0.143856   1.056391    0.815185

                  hetero_mcz  n_fdr_0.05  n_fdr_0.1  n_fdr_0.2
group
NK Proliferating    0.869239         0.0        0.0        0.0
pDC                 1.116590         0.0        0.0        0.0
Plasmablast         1.436206         0.0        0.0        0.0
dnT                 0.087961         0.0        0.0        0.0
NK                 -0.771500         1.0        1.0        1.0
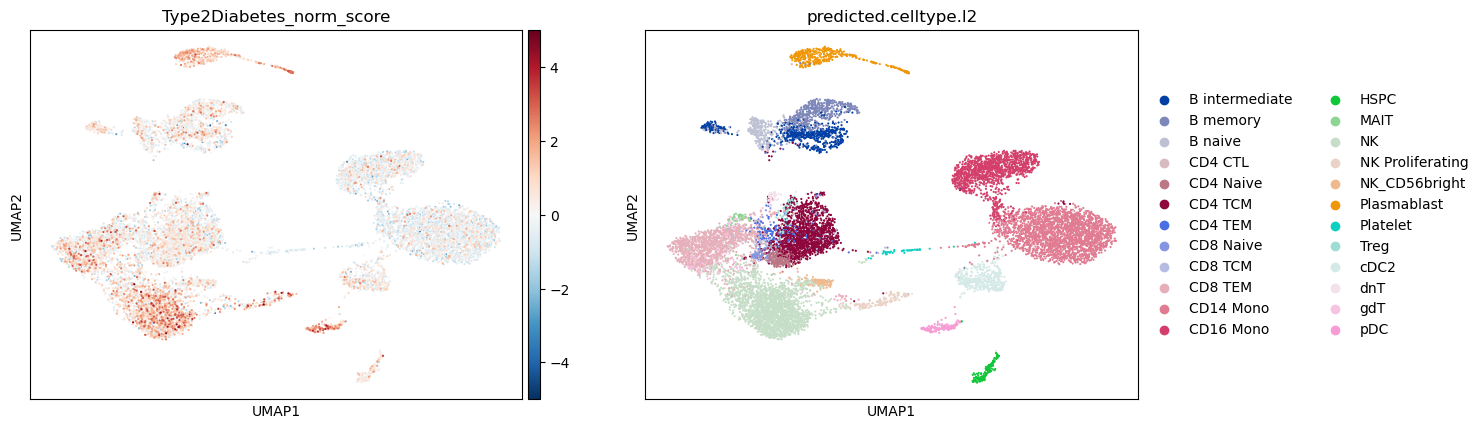
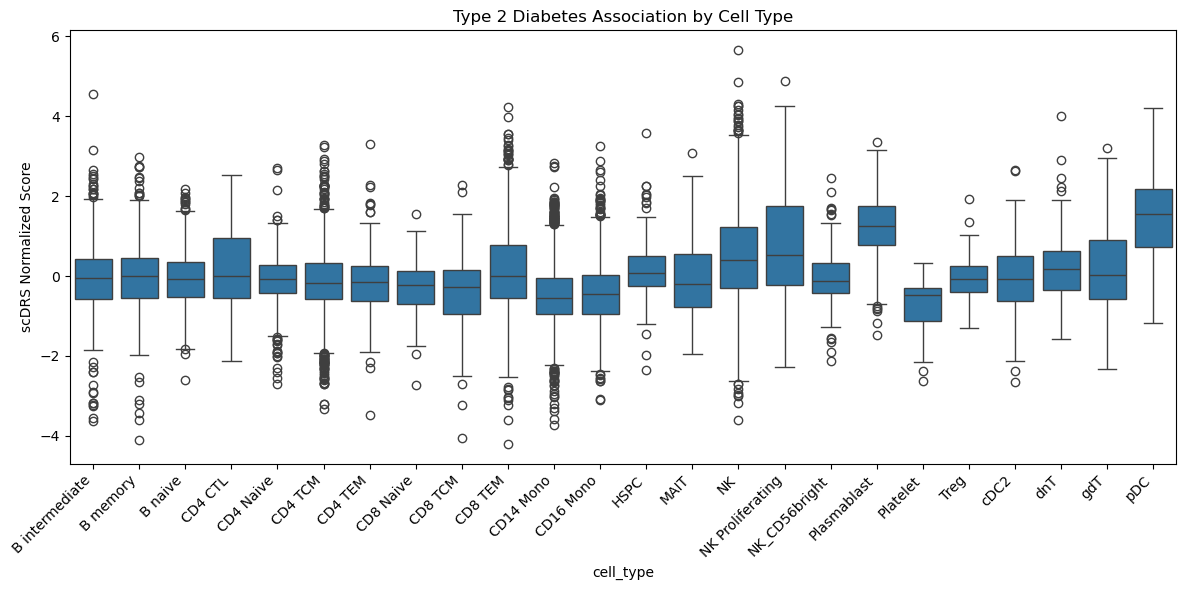
Visualizing scDRS Results#
We first visualize the distribution of the Norm socres and the cell types. Also we then plot the statistic to identify disease-relevant cell populations. Please note, that this is a dummy OneK1K dataset.
adata_scdrs = run_scdrs(
    dd.C,
    gene_sets=gene_sets,
    n_ctrl=1000,
    return_adata=True,
)

sc.pp.neighbors(adata_scdrs)
sc.tl.umap(adata_scdrs)

sc.pl.umap(
    adata_scdrs,
    color=["Type2Diabetes_norm_score", "predicted.celltype.l2"],
    cmap="RdBu_r",
    vmin=-5,
    vmax=5,
)
[2026-01-14 19:15:41,947] INFO:cellink.tl.external._scdrs: Filtering cells and genes
[2026-01-14 19:15:42,025] INFO:cellink.tl.external._scdrs: Preprocessing data for scDRS
Too few genes for 20*20 bins, setting n_mean_bin=n_var_bin=15
[2026-01-14 19:15:43,305] INFO:cellink.tl.external._scdrs: Computing scDRS scores for 1 trait(s)
[2026-01-14 19:15:43,306] INFO:cellink.tl.external._scdrs: Processing Type2Diabetes
sig_cells = score_df[score_df["pval"] < 0.05]
print(f"Found {len(sig_cells)} significantly associated cells (p < 0.05)")

cell_type_scores = pd.DataFrame(
    {
        "cell_type": adata_scdrs.obs["predicted.celltype.l2"],
        "disease_score": adata_scdrs.obs["Type2Diabetes_norm_score"],
    }
)

fig, ax = plt.subplots(figsize=(12, 6))
sns.boxplot(data=cell_type_scores, x="cell_type", y="disease_score", ax=ax)
plt.xticks(rotation=45, ha="right")
plt.ylabel("scDRS Normalized Score")
plt.title("Type 2 Diabetes Association by Cell Type")
plt.tight_layout()
plt.savefig("scdrs_celltype_boxplot.png", dpi=300)
Found 612 significantly associated cells (p < 0.05)
Part 2: Seismic Analysis - Cell Type-Trait Associations#
Seismic identifies which cell types are most relevant to a trait and finds the genes driving these associations.
Running Seismic#
associations = run_seismic(
    dd.C,
    magma_file="trait.genes.out",
    cell_type_col="predicted.celltype.l2",
    species="human",
    top_n_associations=20,
    prefix="t2d_seismic",
    plot_associations=True,
)

print("Top cell type-trait associations:")
print(associations.sort_values("pvalue").head(10)[["cell_type", "pvalue", "FDR"]])

sig_celltypes = associations[associations["FDR"] < 0.05]
print(f"\nSignificant cell types (FDR < 0.05): {len(sig_celltypes)}")
[2026-01-14 19:16:33,480] INFO:cellink.tl.external._seismic: Preparing data for seismic analysis
[2026-01-14 19:16:33,481] INFO:cellink.tl.external._seismic: Filtering cells and genes
[2026-01-14 19:16:33,560] INFO:cellink.tl.external._seismic: Exporting data for R
[2026-01-14 19:16:57,676] INFO:cellink.tl.external._seismic: Saved expression matrix: t2d_seismic_expression.csv.gz
[2026-01-14 19:16:57,701] INFO:cellink.tl.external._seismic: Saved cell metadata: t2d_seismic_metadata.csv
[2026-01-14 19:16:57,709] INFO:cellink.tl.external._seismic: Created R script: t2d_seismic_seismic.R
[2026-01-14 19:16:57,710] INFO:cellink.tl.external._seismic: Running seismic analysis in R...
[2026-01-14 19:17:15,881] INFO:cellink.tl.external._seismic: Loading expression data...
Creating SingleCellExperiment...
Calculating cell type specificity...
Translating gene IDs...
Loading MAGMA results...
Computing cell type-trait associations...
Saved associations to t2d_seismic_associations.tsv
null device
          1
Analysis complete!

[2026-01-14 19:17:15,882] WARNING:cellink.tl.external._seismic: Lade nötiges Paket: SummarizedExperiment
Lade nötiges Paket: MatrixGenerics
Lade nötiges Paket: matrixStats

Attache Paket: ‘MatrixGenerics’

Die folgenden Objekte sind maskiert von ‘package:matrixStats’:

    colAlls, colAnyNAs, colAnys, colAvgsPerRowSet, colCollapse,
    colCounts, colCummaxs, colCummins, colCumprods, colCumsums,
    colDiffs, colIQRDiffs, colIQRs, colLogSumExps, colMadDiffs,
    colMads, colMaxs, colMeans2, colMedians, colMins, colOrderStats,
    colProds, colQuantiles, colRanges, colRanks, colSdDiffs, colSds,
    colSums2, colTabulates, colVarDiffs, colVars, colWeightedMads,
    colWeightedMeans, colWeightedMedians, colWeightedSds,
    colWeightedVars, rowAlls, rowAnyNAs, rowAnys, rowAvgsPerColSet,
    rowCollapse, rowCounts, rowCummaxs, rowCummins, rowCumprods,
    rowCumsums, rowDiffs, rowIQRDiffs, rowIQRs, rowLogSumExps,
    rowMadDiffs, rowMads, rowMaxs, rowMeans2, rowMedians, rowMins,
    rowOrderStats, rowProds, rowQuantiles, rowRanges, rowRanks,
    rowSdDiffs, rowSds, rowSums2, rowTabulates, rowVarDiffs, rowVars,
    rowWeightedMads, rowWeightedMeans, rowWeightedMedians,
    rowWeightedSds, rowWeightedVars

Lade nötiges Paket: GenomicRanges
Lade nötiges Paket: stats4
Lade nötiges Paket: BiocGenerics

Attache Paket: ‘BiocGenerics’

Die folgenden Objekte sind maskiert von ‘package:stats’:

    IQR, mad, sd, var, xtabs

Die folgenden Objekte sind maskiert von ‘package:base’:

    Filter, Find, Map, Position, Reduce, anyDuplicated, aperm, append,
    as.data.frame, basename, cbind, colnames, dirname, do.call,
    duplicated, eval, evalq, get, grep, grepl, intersect, is.unsorted,
    lapply, mapply, match, mget, order, paste, pmax, pmax.int, pmin,
    pmin.int, rank, rbind, rownames, sapply, setdiff, sort, table,
    tapply, union, unique, unsplit, which.max, which.min

Lade nötiges Paket: S4Vectors

Attache Paket: ‘S4Vectors’

Das folgende Objekt ist maskiert ‘package:utils’:

    findMatches

Die folgenden Objekte sind maskiert von ‘package:base’:

    I, expand.grid, unname

Lade nötiges Paket: IRanges
Lade nötiges Paket: GenomeInfoDb
Lade nötiges Paket: Biobase
Welcome to Bioconductor

    Vignettes contain introductory material; view with
    'browseVignettes()'. To cite Bioconductor, see
    'citation("Biobase")', and for packages 'citation("pkgname")'.


Attache Paket: ‘Biobase’

Das folgende Objekt ist maskiert ‘package:MatrixGenerics’:

    rowMedians

Die folgenden Objekte sind maskiert von ‘package:matrixStats’:

    anyMissing, rowMedians

Warnmeldung:
In check_overlap(sscore, magma, magma_gene_col) :
  Only 0.843881856540084% (12 genes)
          of genes map between seismic specificity scores and the MAGMA
          input. If this is unexpected, please check the identifiers between
          these files or change the magma_gene_col and try again.

[2026-01-14 19:17:15,883] INFO:cellink.tl.external._seismic: Reading results
Top cell type-trait associations:
          cell_type    pvalue       FDR
0  NK Proliferating  0.138858  0.813065
1               pDC  0.163194  0.813065
2               gdT  0.163979  0.813065
3                NK  0.217295  0.813065
4     NK_CD56bright  0.257984  0.813065
5           CD8 TEM  0.266350  0.813065
6               dnT  0.305833  0.813065
7       Plasmablast  0.313101  0.813065
8           B naive  0.388835  0.813065
9          B memory  0.409141  0.813065

Significant cell types (FDR < 0.05): 0
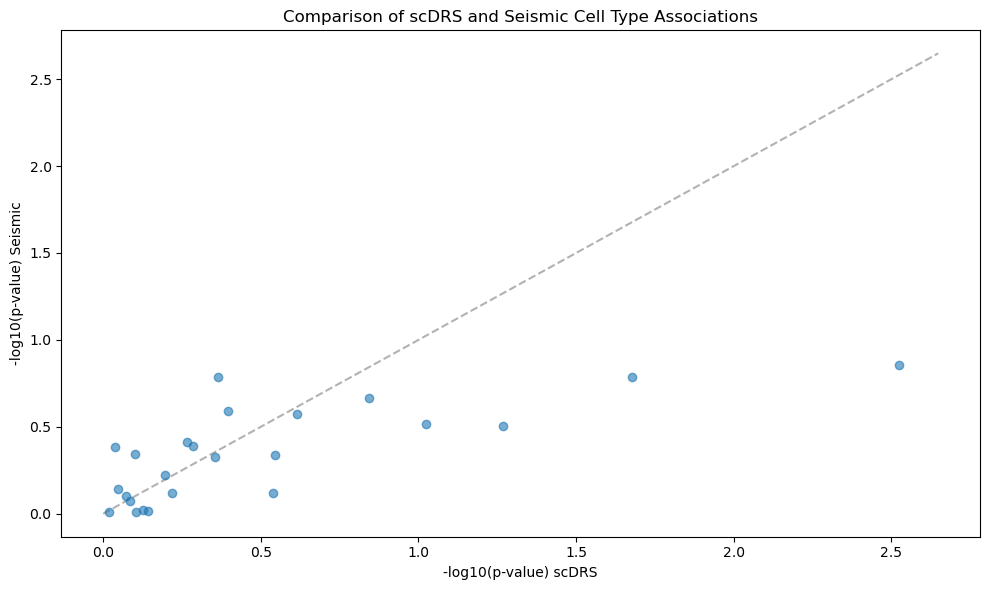
Part 3: Comparing Methods#
scdrs_ct = ct_results.copy()
scdrs_ct["method"] = "scDRS"
scdrs_ct["log_pval"] = -np.log10(scdrs_ct["assoc_mcp"])

seismic_ct = associations.copy()
seismic_ct["method"] = "Seismic"
seismic_ct["log_pval"] = -np.log10(seismic_ct["pvalue"])

fig, ax = plt.subplots(figsize=(10, 6))

comparison = pd.merge(
    scdrs_ct[["log_pval"]],
    seismic_ct[["cell_type", "log_pval"]],
    left_index=True,
    right_on="cell_type",
    suffixes=("_scDRS", "_Seismic"),
)

ax.scatter(comparison["log_pval_scDRS"], comparison["log_pval_Seismic"], alpha=0.6)
ax.set_xlabel("-log10(p-value) scDRS")
ax.set_ylabel("-log10(p-value) Seismic")
ax.set_title("Comparison of scDRS and Seismic Cell Type Associations")

lims = [0, max(ax.get_xlim()[1], ax.get_ylim()[1])]
ax.plot(lims, lims, "k--", alpha=0.3, zorder=0)

plt.tight_layout()
plt.savefig("scdrs_seismic_comparison.png", dpi=300)